nyc-311
Data Set
- Data set contains nearly 17 million individual service requests for New York City 311 from 2010 to 2017
- Each record includes information such as:
- service request type
- service request open/close date and time
- location (latitude, longitude, address, zip code)
- resolution status and description (including name of agency which handled the request)
- additional details (park, school, bridge, taxi company, ferry)
Data Cleaning
- Loaded the data into a single data frame
- Cleaned complaints (originally 310 types): format, removed
rare complaint types (types with less than 50 complaints)
- Narrowed down to 253 types
- Cleaned zip codes: trimmed to 5 digits, kept only those corresponding to NYC (207)
- Only kept zip codes with more than 50 complaints
- Thus narrowed down to 227 request types and 193 zip codes
Figure 1: Frequency of the different types of complaints (word cloud)

Neighborhood Typology
- Grouped the data by neighborhood based on zip codes
- Then we can define the typology of a neighborhood as the vector of frequencies of each complaint type
- Then ran a clustering algorithm (K-means) on the neighborhood typologies to group them into categories
- Problem: choosing the optimal number k of clusters
- ran several methods to determine the optimal number of clusters, which yielded slightly different results: 3 for elbow and silhouette, clear improvement up to 4 for the gap statistic
- We set k = 4.
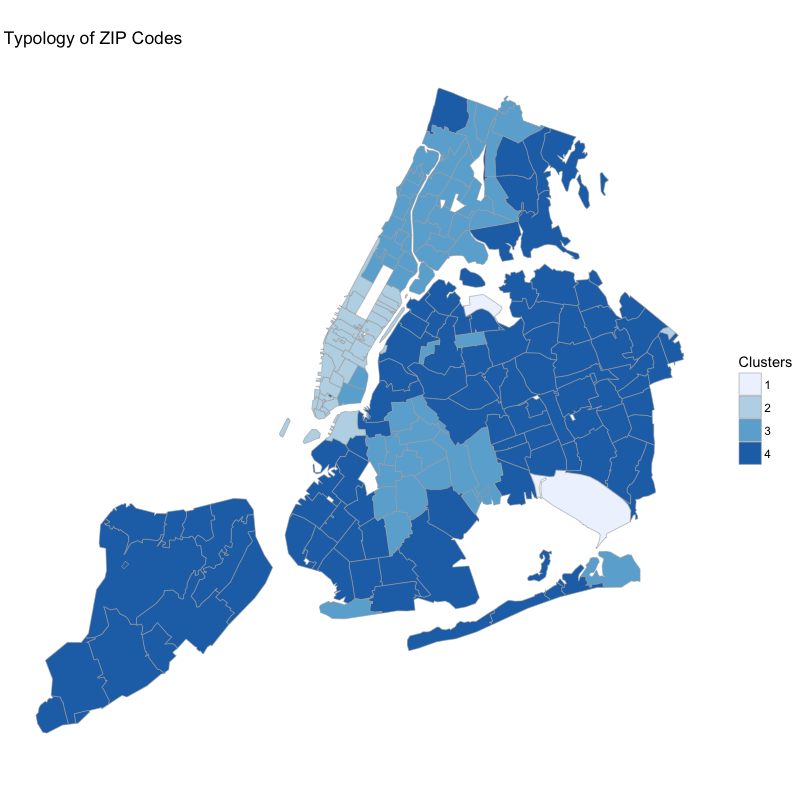
Figure 2: Typology of NYC Zip Codes

Results
- The clusters obtained seem to make sense
- Cluster 1 includes JFK and LGA airport
- Cluster 2 includes Midtown and Downtown Manhattan
- Cluster 3 includes Northern Manhattan, the Bronx and Central Brooklyn
- Cluster 3 includes Southern/Eastern Brooklyn, Eastern Bronx, Queens and Staten Island
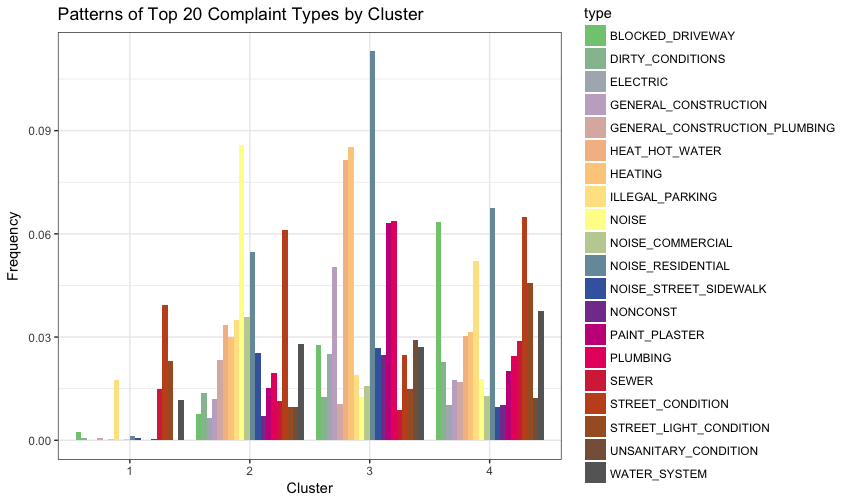
- Then looking at patterns in the distribution of the 20 most
common complaint types within each cluster we can see that
- Cluster 1 has a high frequency of illegal parking complaints
- Cluster 2 has the highest frequency of noise complaints, corresponding to very busy areas
- Cluster 3 exhibits the most complaints about heating and hot water, as well as noise from residential sources, suggesting somewhat run-down residential neighborhoods
- Cluster 4 has high frequency of complaints about blocked driveways, street condition and noise from residential sources, indicating more suburban residential areas.
Figure 3: Patterns of Top 20 Complaint Types by Cluster

Further Analysis
To take this analysis a step further, I could have used external data such as census data to study correlation of those typologies with:
- Demographic and socioeconomic features: employment and education levels, median income, ethnicity
- Housing data: real estate prices
- Public safety: crimes and felonies
- Mass transit: MTA ridership statistics, traffic incidents
- Hospital inpatient data
- Public school enrollment